In the ever-evolving world of stock markets and trading, one strategy that stands the test of time is Technical Analysis. Whether you’re a beginner investor or an experienced day trader, technical analysis can help you decode market behavior and make informed decisions. But what exactly is technical analysis, and how can you use it to your advantage? we’ll explore technical analysis in detail—its core concepts, tools, advantages, disadvantages, and practical examples to help you get started confidently.
What is Technical Analysis?
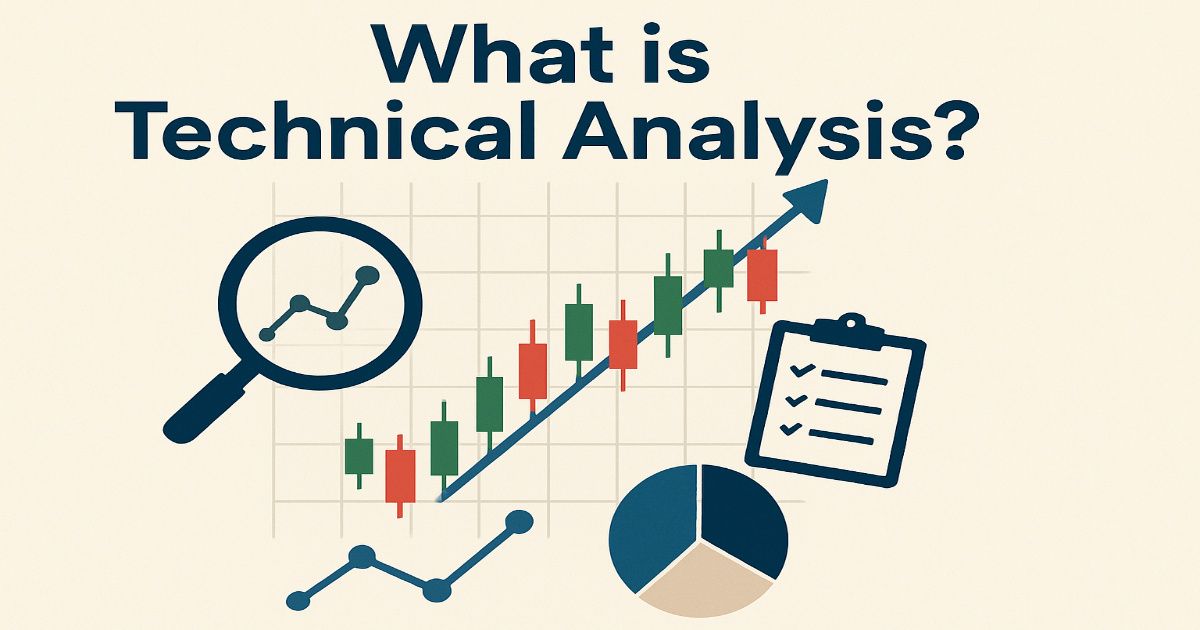
Technical Analysis is the study of past market data—primarily price and volume—to forecast the future movement of asset prices. It is widely used in stock markets, forex trading, cryptocurrencies, commodities, and other financial instruments.
Unlike fundamental analysis, which examines a company’s financials and business model, technical analysis focuses purely on the behavior of the market through visual charts, patterns, and indicators.
Core Assumptions of Technical Analysis
Technical analysis is based on three core principles:
1. Market Discounts Everything
All available information (fundamentals, news, earnings, etc.) is already reflected in the current price. So, there’s no need to analyze financial statements—price is the ultimate truth.
2. Prices Move in Trends
Markets move in identifiable trends. These can be uptrends (bullish), downtrends (bearish), or sideways. Once a trend is established, it tends to persist unless something shifts market sentiment significantly.
3. History Repeats Itself
Investor psychology creates repetitive patterns. Chart patterns such as Head & Shoulders or Double Bottoms reflect crowd behavior and tend to appear regularly.
Tools & Components of Technical Analysis
Technical analysis uses several tools and techniques to analyze market data. Let’s break them down:
1. Charts
Charts form the foundation of technical analysis. They visually represent price movements over time.
- Line Chart – Simplest form, connects closing prices.
- Bar Chart – Shows open, high, low, and close (OHLC) data.
- Candlestick Chart – Most widely used; visually appealing and informative, showing the full price range per period.
2. Trends and Trendlines
Identifying trends is crucial:
- Uptrend – Higher highs and higher lows.
- Downtrend – Lower highs and lower lows.
- Sideways/Range-bound – Horizontal movement within a set price range.
Trendlines are drawn on charts to connect highs or lows, helping traders identify the direction of the market.
3. Support and Resistance
- Support is the price level where demand is strong enough to stop the price from falling further.
- Resistance is where selling pressure prevents the price from rising higher.
These levels act as psychological barriers and are key zones to watch for trade setups.
4. Chart Patterns
Chart patterns are recurring formations that suggest future price action.
Common Patterns:
- Head and Shoulders
- Double Top & Double Bottom
- Triangles (Ascending, Descending, Symmetrical)
- Flags and Pennants
- Cup and Handle
Patterns signal continuation or reversal of trends.
5. Technical Indicators and Oscillators
Indicators help validate trends, identify momentum, and generate buy/sell signals.
| Indicator | Purpose |
|---|---|
| Moving Averages (MA, EMA) | Smooth price data to show trends |
| MACD | Trend-following and momentum indicator |
| RSI (Relative Strength Index) | Measures overbought/oversold levels |
| Bollinger Bands | Show volatility and possible reversals |
| Stochastic Oscillator | Detects momentum and reversal signals |
6. Volume Analysis
Volume tells the strength behind a price movement. Rising prices with high volume suggest strong buying interest, while low volume may indicate a weak or unsustainable move.
Types of technical analysis
| Type | Focus Area | Tools/Examples |
|---|---|---|
| Price Action | Raw price movement | Candlesticks, Trendlines, S/R |
| Indicator-Based | Mathematical formulas | RSI, MACD, Moving Averages |
| Pattern-Based | Chart structures | Head & Shoulders, Triangles |
| Volume-Based | Volume strength | OBV, VWAP, Volume Bars |
| Trend Analysis | Market direction | ADX, Trendlines, MAs |
| Sentiment via Charts | Crowd behavior | VIX, Volume Spikes, Breakouts |
| Multi-Time Frame Analysis | Multiple chart views | Daily + Intraday combo |
How to Use Technical Analysis in Real Trading
Step 1: Identify the Trend
Start with the broader trend using tools like Moving Averages or Trendlines.
Step 2: Look for Entry Points
Use support/resistance zones or chart patterns to plan entries.
Step 3: Use Indicators for Confirmation
Check indicators like RSI or MACD to confirm the trend’s strength.
Step 4: Set Targets and Stop Loss
Always define a target price and a stop-loss level to manage risk.
Example of Technical Analysis in Action
Let’s say a stock is trading at ₹480 and has bounced off ₹470 multiple times. That becomes the support level.
If the RSI is below 30 (oversold), and a bullish candlestick pattern forms near the support zone, a trader might buy the stock with a target of ₹510 (next resistance) and a stop loss at ₹465.
This setup uses support level, RSI, candlestick pattern, and risk management—all technical tools combined for a logical decision.
Advantages of Technical Analysis
- Quick Decision Making
No need to read lengthy reports—just analyze charts. - Ideal for Short-Term Trading
Especially useful for intraday and swing traders. - Identifies Entry/Exit Points
Helps define precise levels for buying and selling. - Visual Learning
Charts are easy to interpret and provide real-time insights.
Limitations of Technical Analysis
- False Signals
Patterns and indicators may mislead in volatile markets. - Does Not Consider Fundamentals
Doesn’t reflect financial health or business performance. - Requires Discipline & Experience
Interpretation varies; results depend on trader’s skill. - Subjectivity
Two traders may read the same chart differently.
Technical Analysis vs Fundamental Analysis
| Feature | Technical Analysis | Fundamental Analysis |
|---|---|---|
| Focus | Price & Volume | Financials & Business |
| Time Frame | Short to Medium Term | Long Term |
| Tools | Charts, Patterns, Indicators | Balance Sheet, P&L, Ratios |
| Usage | Trading | Investing |
Who Should Use Technical Analysis?
- Intraday Traders
- Swing Traders
- Options Traders
- Crypto Traders
- Even Investors for better entry/exit timing
Whether you’re buying for a day or holding for months, technical analysis helps you optimize timing.
Key Concepts in Technical Analysis
Here are the most important and easy-to-understand Key Concepts in Technical Analysis — perfect for blog content, notes, or a beginner’s trading guide.
Price Discounts Everything
The core principle of technical analysis is that all known information (company earnings, news, economic data, etc.) is already reflected in the current market price.
✔️ You don’t need to analyze financial reports—just study the price chart.
Price Moves in Trends
Markets don’t move randomly. They follow trends:
- Uptrend: Higher highs and higher lows
- Downtrend: Lower highs and lower lows
- Sideways: Horizontal movement in a range
Identifying the trend direction helps traders make smarter decisions.
Support and Resistance
These are key price levels where the market tends to reverse:
- Support: Price level where buying interest prevents further fall.
- Resistance: Price level where selling pressure halts an upward move.
They act like psychological barriers on the chart.
Technical Indicators
Indicators help measure:
- Trend direction (e.g., Moving Averages)
- Momentum (e.g., RSI, MACD)
- Volatility (e.g., Bollinger Bands)
They provide buy/sell signals and confirm price actions.
Chart Patterns
Chart patterns help predict future movement.
Common types:
- Continuation Patterns: Triangle, Flag, Pennant
- Reversal Patterns: Double Top, Double Bottom, Head & Shoulders
Traders use these for planning entry, exit, and stop-loss levels.
Candlestick Analysis
Candlestick charts show:
- Open, High, Low, Close (OHLC) data
- Bullish/Bearish reversal signals (e.g., Doji, Hammer, Engulfing)
Candlestick formations are fast and effective at showing short-term sentiment.
Risk Management
Technical analysis is not 100% accurate. That’s why risk control is crucial.
- Always use stop-loss
- Calculate position size
- Maintain risk-to-reward ratio (preferably 1:2 or higher)
Conclusion
Technical Analysis is both an art and a science. It doesn’t guarantee profits but provides a framework to make more informed, disciplined, and objective trading decisions. By learning how to read charts, spot trends, and use indicators, you can gain an edge in the markets—whether you’re trading stocks, crypto, or forex.
However, always remember: technical analysis works best when combined with sound money management and emotional control.
FAQs
Is technical analysis good for beginners?
Yes, it’s a great starting point to understand market behavior. But practice and patience are essential.
Can technical analysis predict the market accurately?
Not always. It improves probability, not certainty. Always use stop-loss.
What is the best time frame for technical analysis?
Depends on your trading style—5-min for intraday, daily/weekly for swing or long-term.
Is technical analysis better than fundamental analysis?
Both have their uses. Traders prefer technicals, long-term investors often rely on fundamentals.
Do professional traders use technical analysis?
Yes. Many hedge funds and institutional traders use technical tools, especially for timing trades.
Can I use technical analysis for long-term investing?
Yes, while technical analysis is often used for short-term trading, long-term investors also use it to find ideal entry and exit points, especially when combined with fundamental analysis.
How is technical analysis different from price action?
Price action is a subset of technical analysis that focuses solely on raw price movements without relying on indicators. Technical analysis, on the other hand, includes indicators, chart patterns, and volume analysis along with price action.
Is technical analysis effective in crypto trading?
Yes, technical analysis is widely used in crypto markets due to the lack of reliable fundamentals and the high volatility, which makes chart patterns and price behavior crucial for traders.
How much time does it take to learn technical analysis?
You can learn the basics in a few weeks, but mastering chart reading, patterns, and strategy development typically takes months of consistent practice and experience.
Do I need paid software for technical analysis?
No. Many free platforms offer comprehensive charting tools and indicators. However, advanced traders may prefer paid tools for custom strategies, alerts, and real-time data.
Can technical analysis be automated?
Yes, many traders use algorithms and bots based on technical indicators to automate trades. Platforms like MetaTrader, TradingView (with Pine Script), and AlgoTrader allow such automation.
What are the technical analysis methods?
Technical analysis mostly uses bar charts, candlestick charts, line charts, and point and figure charts. Technical analysts utilize these chart patterns to identify trade signals.
Disclaimer
The information provided in this blog is for educational and informational purposes only. It does not constitute financial, investment, or trading advice. Technical analysis involves a level of risk, and past performance is not indicative of future results. Readers are advised to do their own research or consult a certified financial advisor before making any trading or investment decisions. The author and publisher are not responsible for any losses or damages arising from the use of this information.


